ExpertWind Insights: Q4 2025 Product Update
2025-12-15 · News
By ExpertWind Team
This quarter brings new wind farm performance diagnostics, improved analysis tools and clearer visibility into turbine behaviour. We also prepared the foundation for regular public updates, which will continue in future releases.
Improved Issue Tracking and Workflow
The Issues page has been redesigned to better connect Insights results with the actions operators can take. We improved how detected issues are presented and classified, and we updated the suggestion logic so operators more clearly see what to focus on.
This makes the Issues section the main link between results and actions, where users can convert results into improvements to their assets.
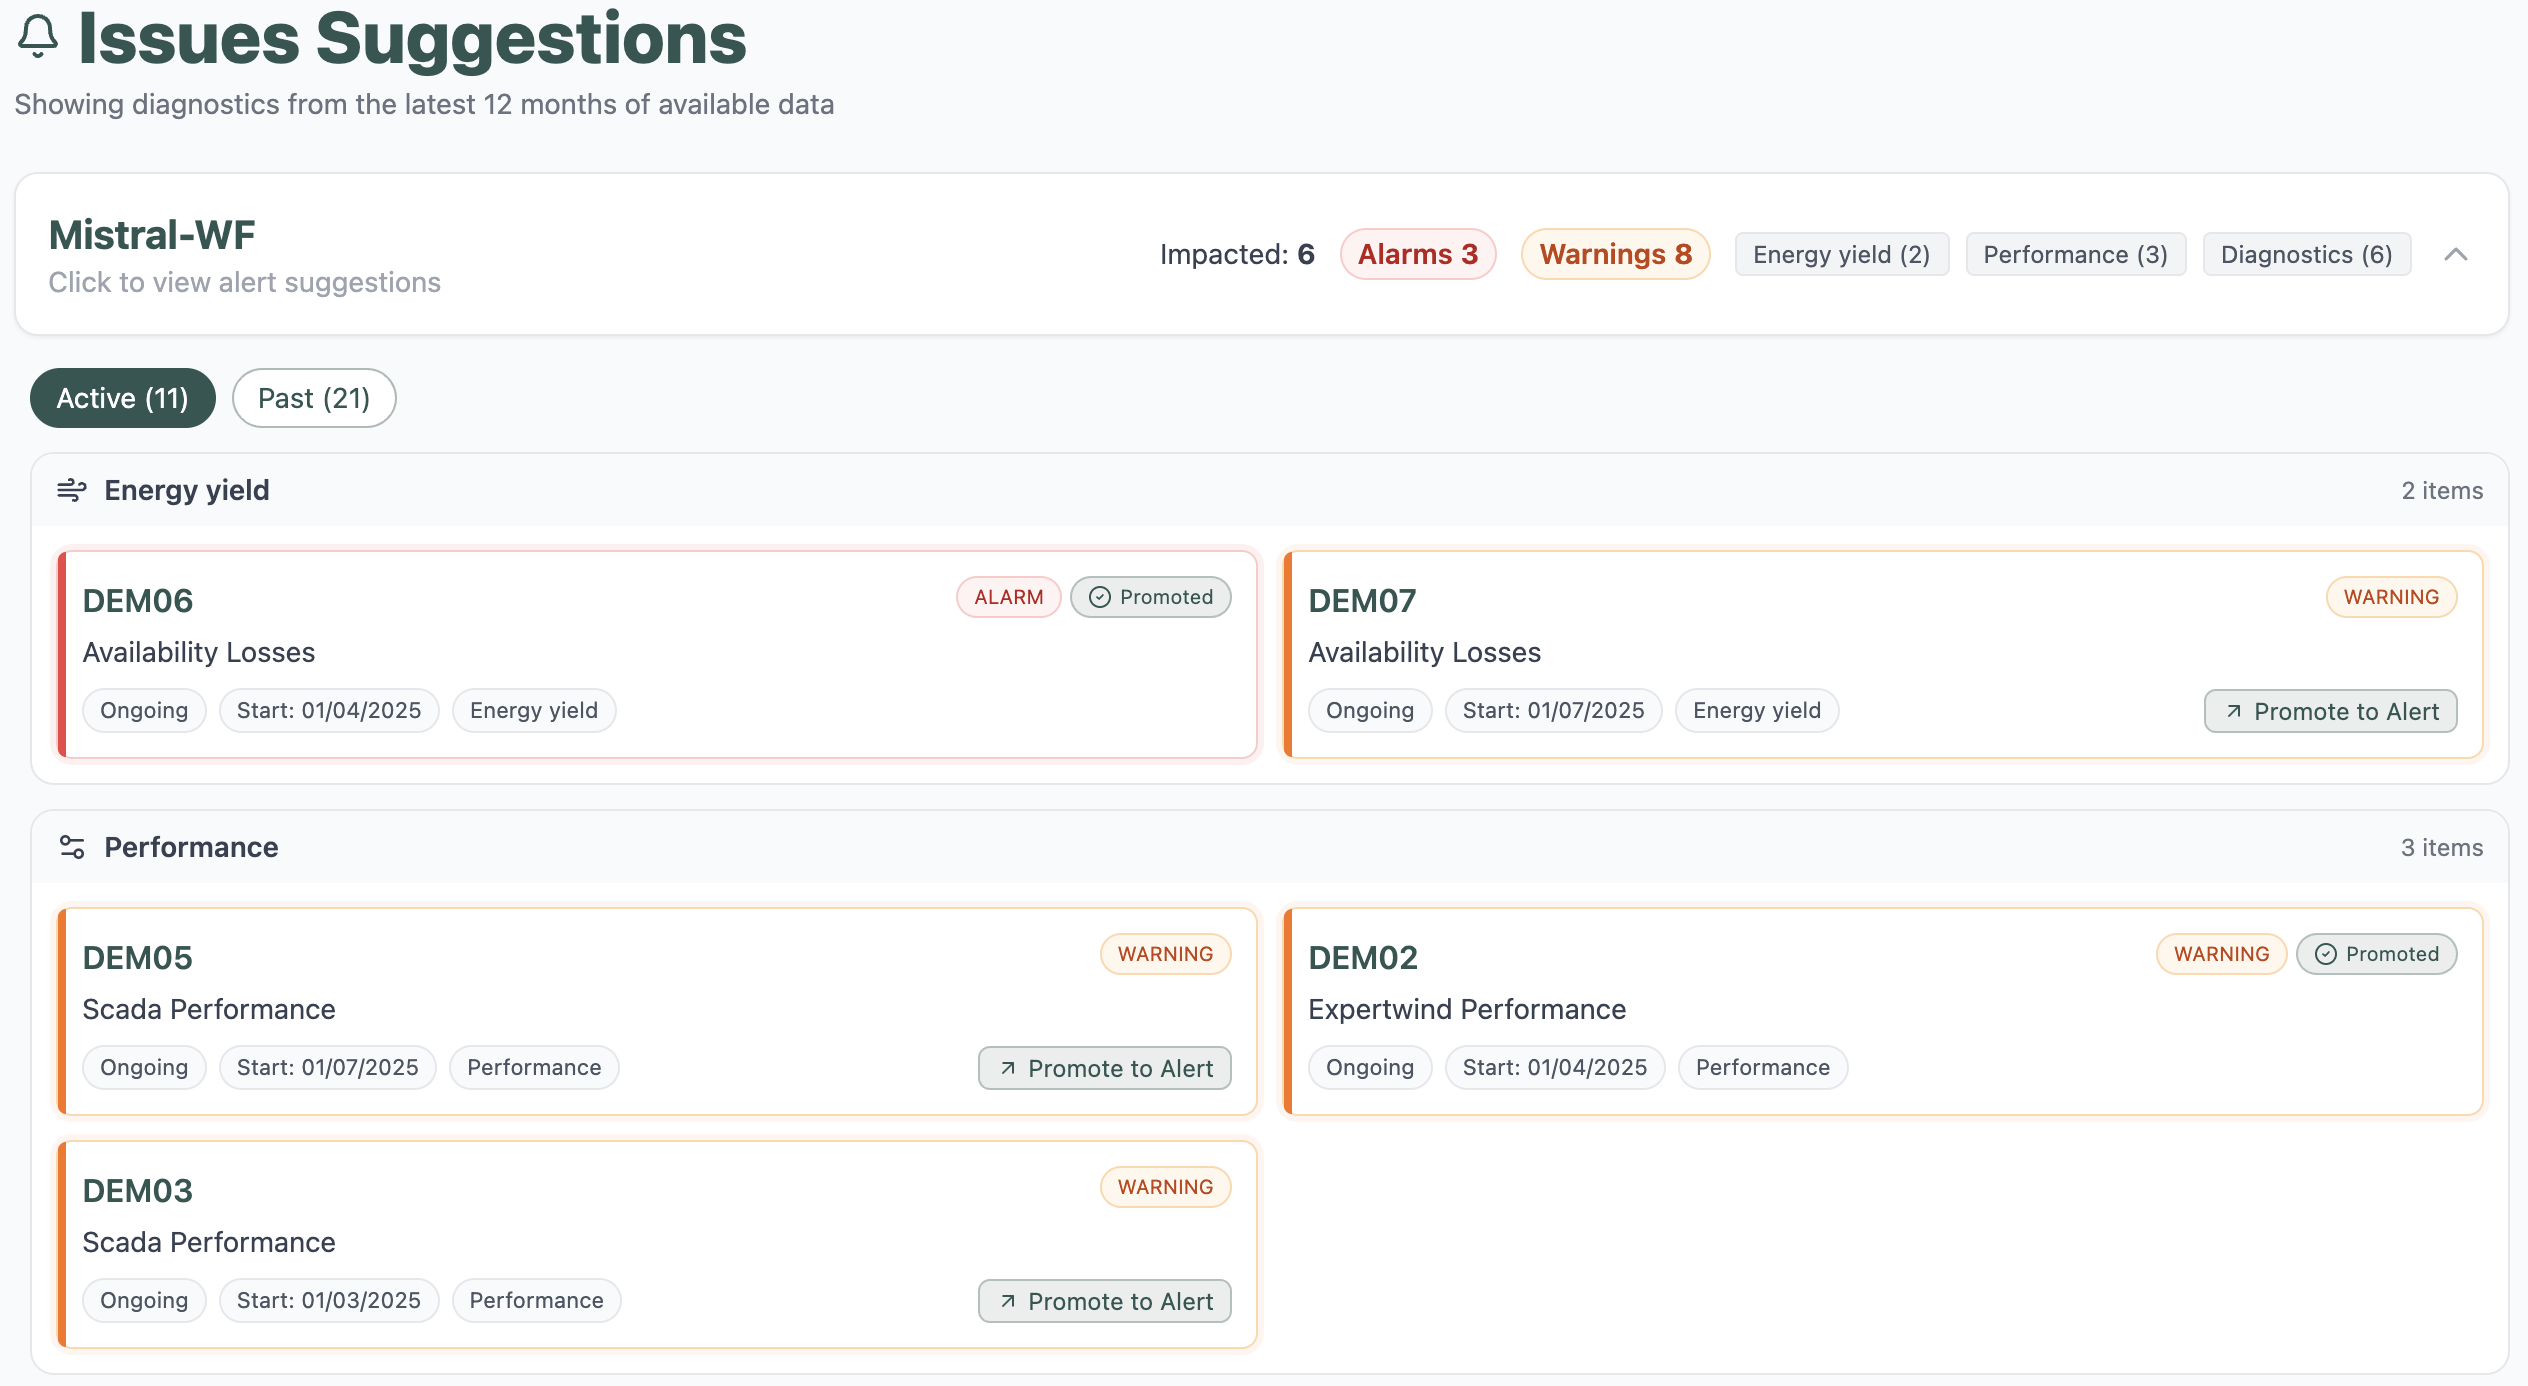 Fig. 1: Improved Issue page for a wind farm, showing how Insights presents detected issues at a turbine and wind farm level.
Improved Wind Condition results
Farm and Turbine Wind Condition pages have been updated with clearer summaries, new KPIs and improved wind charts. The goal is to give operators a more direct and reliable view of the conditions each farm and each turbine experienced.
These changes make it easier to understand month to month and long term variations in wind, differences between turbines and key results such as wind distributions, wind roses, turbulence intensity and sector-based operation.
New Feature: Power Plateau
The Power Plateau feature highlights how turbines operate at rated power, a region that is often overlooked in standard performance analysis. It shows whether turbines reach and sustain their expected output, how they behave during high-wind periods and where production or availability gaps appear.
This completes our view of performance across all operating conditions and gives operators visibility on the part of the curve with the greatest impact on energy yield.
New Feature: Power Curve Analyser
The Power Curve Analyser, available in Data Studio, gives operators a flexible way to explore how the power curve changes under different external conditions. It allows users to evaluate sensitivity to factors such as wind direction, turbulence or dynamic yaw error.
It is designed to support deeper analysis when operators want to understand how external conditions influence performance.
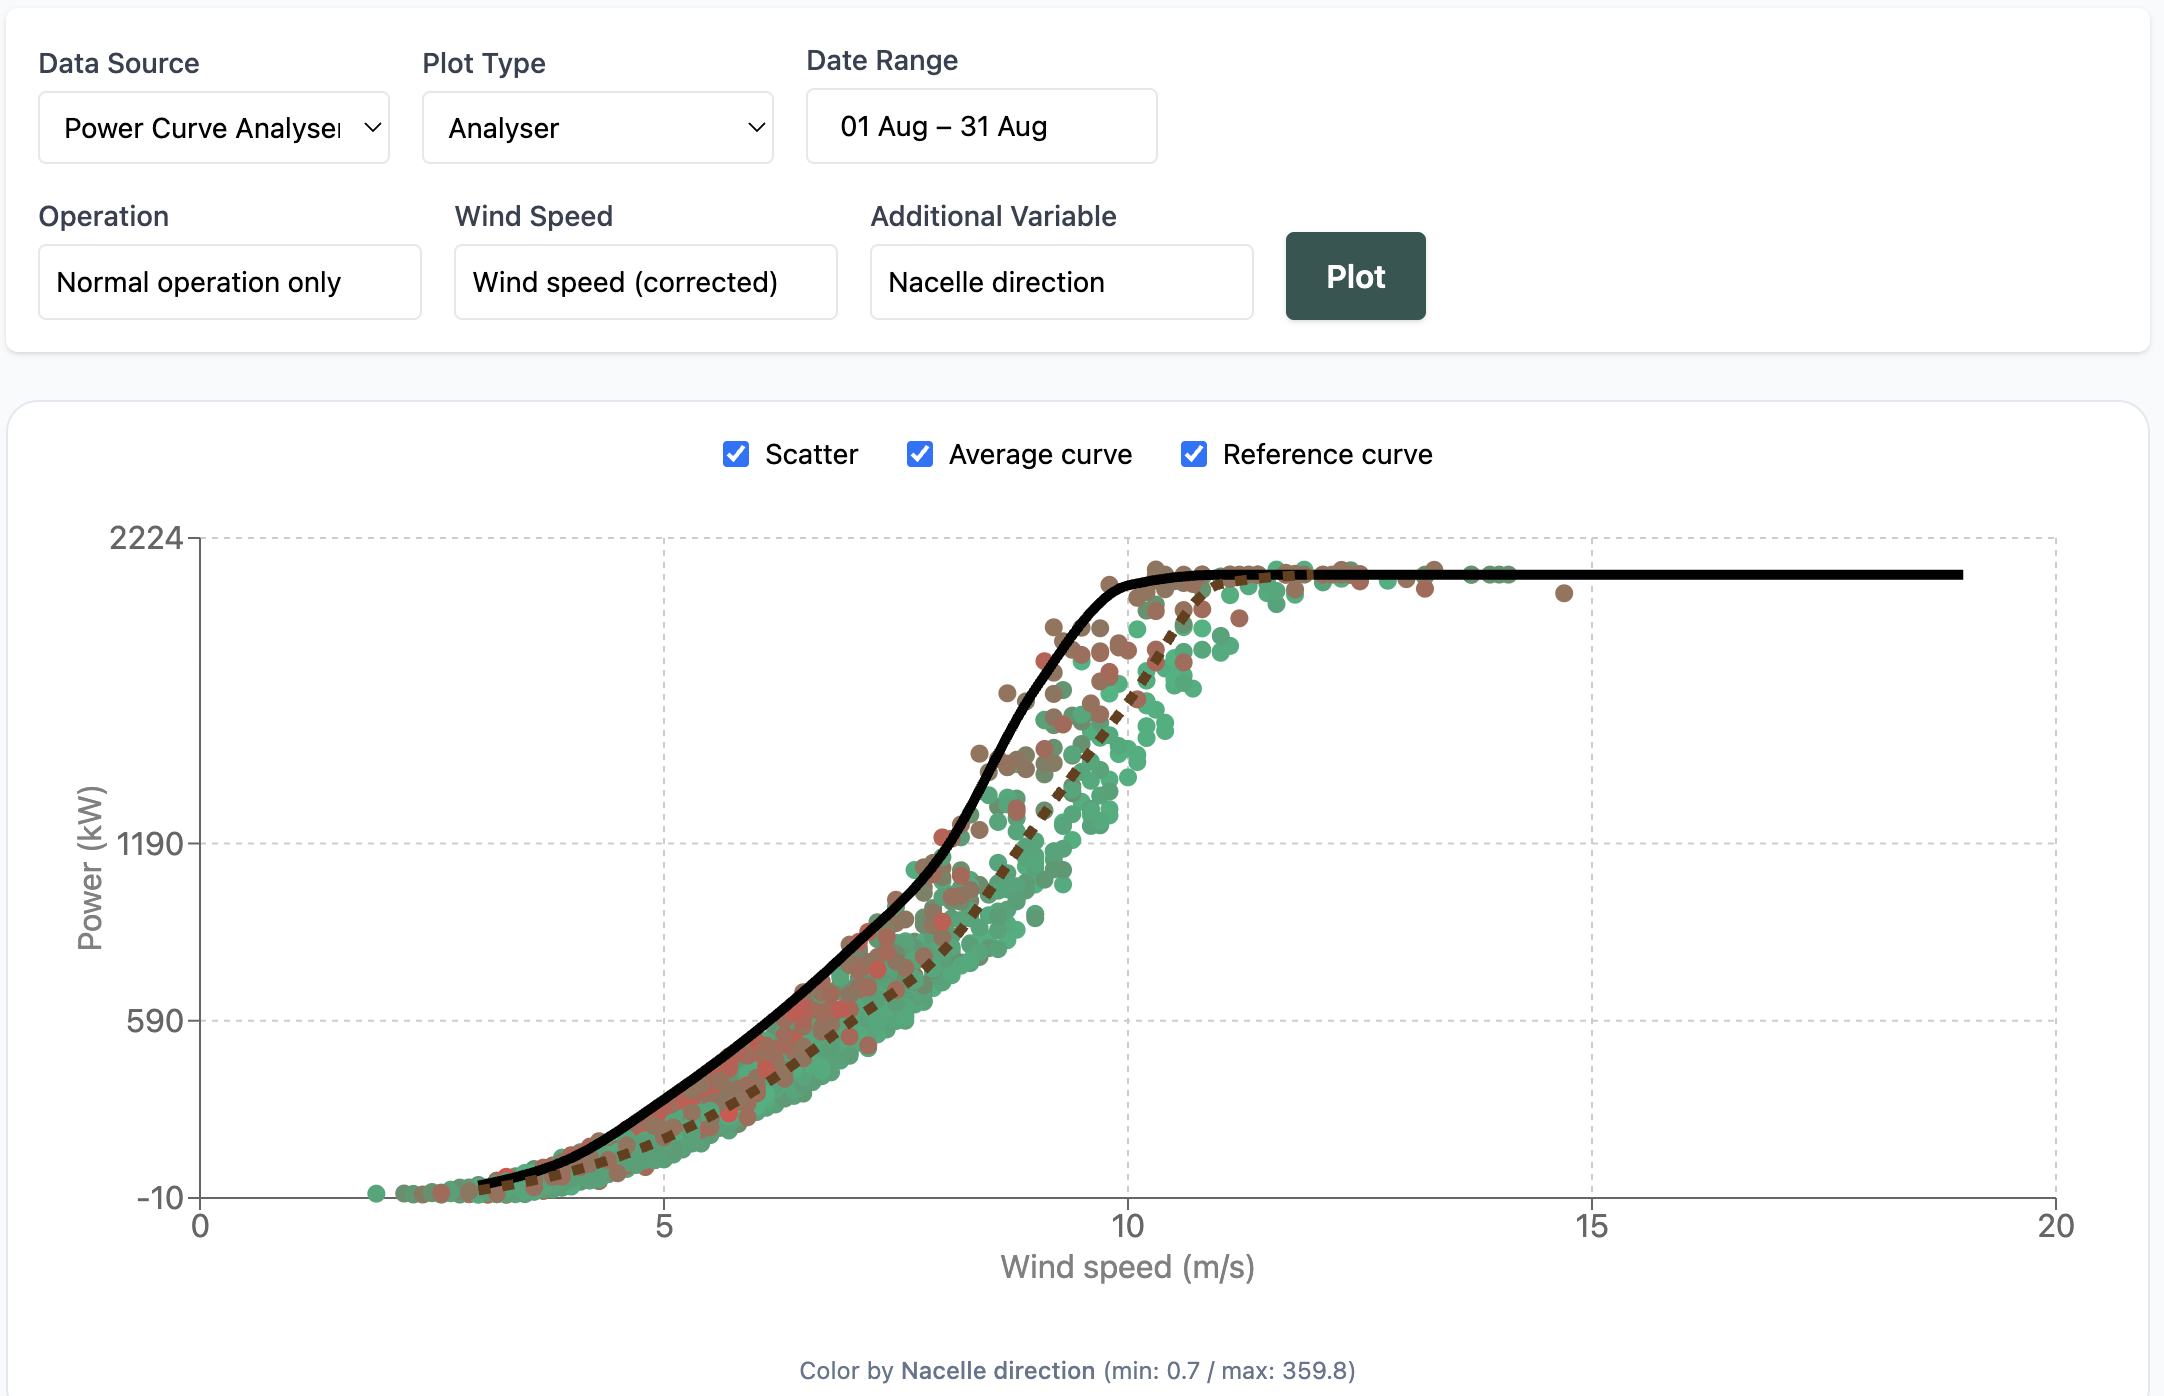 Fig. 2: Power Curve Analyser for a turbine with a strong sector effect, where two dominant wind sectors create clearly
different power curve behaviours.
Fig. 2: Power Curve Analyser for a turbine with a strong sector effect, where two dominant wind sectors create clearly
different power curve behaviours.
Wind-speed correction insights
Our wind speed correction methods are a key factor for stable and reliable performance and operation monitoring. With that in mind, we added a dedicated view showing the monthly wind-speed correction applied to each turbine. It includes the overall correction level, the impact on performance and the wind-speed binned correction values.
This gives operators a clear understanding of how the wind speed measurement behaves and how the correction supports more reliable performance interpretation.
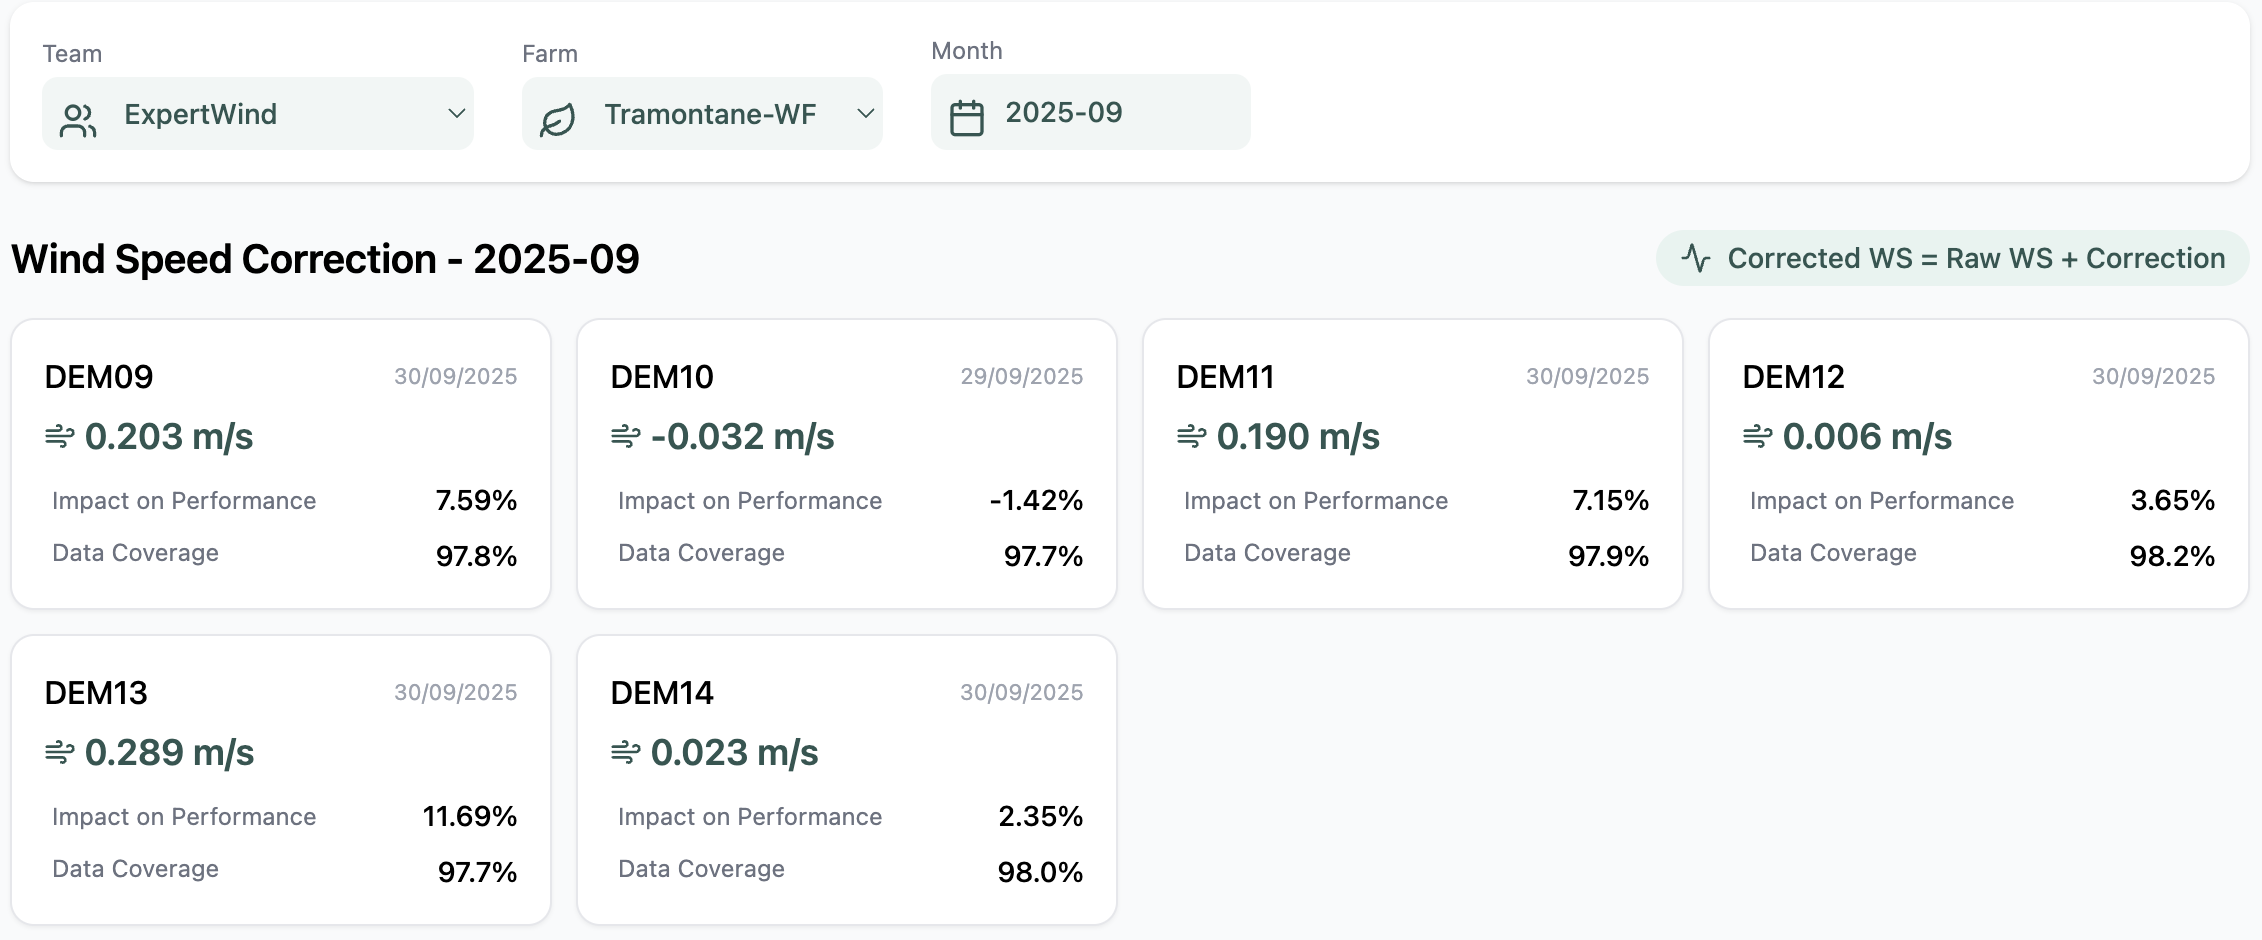 Fig. 3: Wind speed correction summary for a wind farm, showing the average correction applied and its impact on performance
interpretation.
Fig. 3: Wind speed correction summary for a wind farm, showing the average correction applied and its impact on performance
interpretation.
Additional improvements
This release also includes several smaller updates that make Insights more consistent and easier to use. We removed overlapping views, refined the visuals on key pages and improved how some charts behave in complex datasets. The Login page was refreshed, power curve clustering was improved for noisy data and Yaw Dynamics results were improved to a more reliable and comparable diagnostic.
These refinements support a smoother experience across the platform and reflect our ongoing commitment to improve Insights, keep innovating and give operators the best experience we can deliver.
Ready to see ExpertWind Insights in action? Schedule a demo and we’ll walk you through your first analysis.
Prefer to explore on your own? Visit Insights to learn more about capabilities, plans and how tokens work alongside subscriptions.